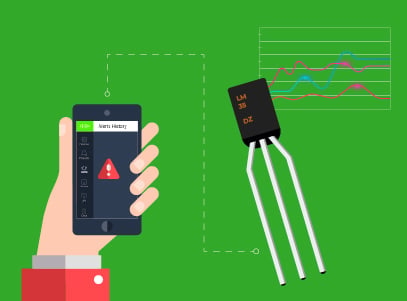
Recently Bolt launched the alert feature, where you can send alerts based on the condition of sensor data. This feature is very helpful and easy to implement without writing any code. In this project, we will create alerts based on the temperature data of LM35 sensor and also plot the graph for viewing the sensor data.
Things used in this project
- Hardware components
- Software apps and online services
- Bolt Cloud
- Bolt IoT android App
Hardware Setup
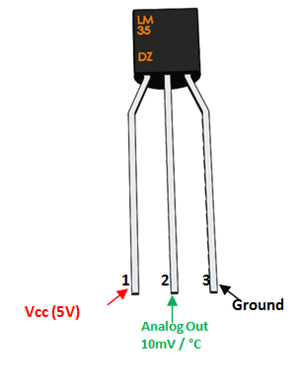
LM35 is an integrated analog temperature sensor whose electrical output is proportional to Degree Centigrade.
Step 1: LM35 to Bolt connection
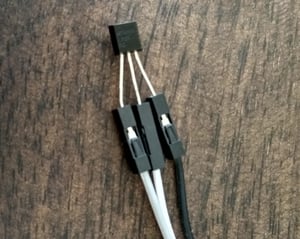
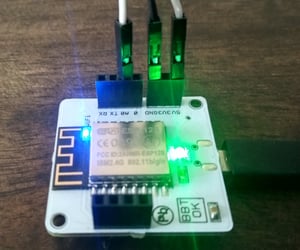
Follow the instruction below to connect your LM35 sensor to Bolt Device.
- Make sure you have not powered on your Bolt Module white connecting the circuit. This will ensure that in case we make any mistake, it will not short circuit your device. Switch off the power if it is connected.
- Connect the VCC pin of LM35 to 5V pin of the Bolt device.
- Connect the GND pin of LM35 to GND pin of the Bolt device.
- Connect the analog output pin of LM35 to A0 (analog input) pin of the Bolt device.
Software Programming
Step 1: Prerequisite
In this experiment, I am assuming that you have done the setting up your Bolt device and have linked your device to the cloud product. Refer the below link if you have not done.
- Setting up the Bolt wifi module
- Creating a product - In this project since we are using the A0 pin as an input pin and we are collecting the data over GPIO so choose the Input Devices and GPIO while creating the product.
- Link your device to the product
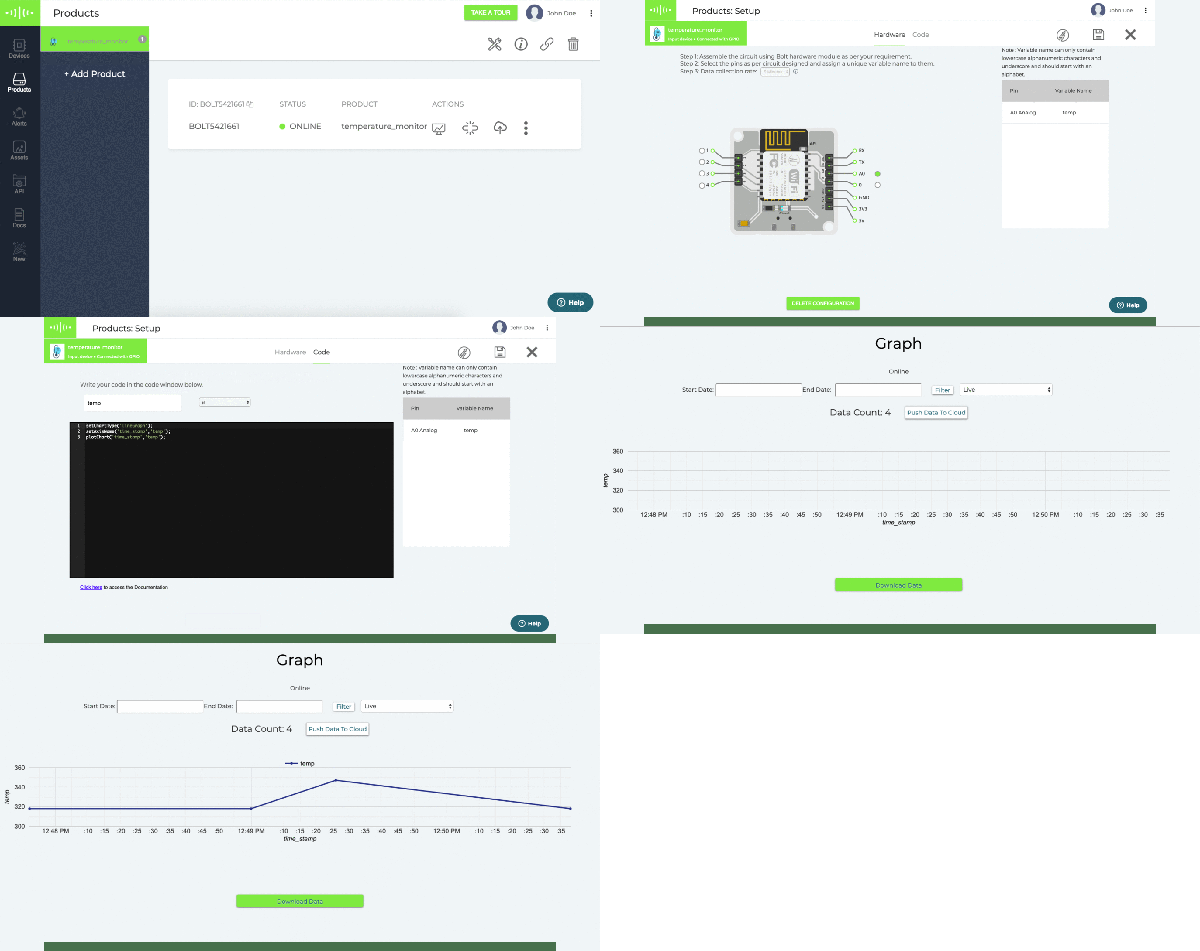
Step 2: Configuring product for plotting the graph
As we have already linked our device to the product, in this section, we will configure the product for plotting the temperature data. The graph is showing the voltage data. If you want to convert the voltage data in degree Celsius, then divide the voltage data by 10.24
Follow the below step for configuring the product.
- Click on the product tab on Cloud Dashboard.
- Click on the name of the product that you want to configure.
- Click on the configure icon that is on the top right corner.
- Select the A0 pin, assigned a name to it in variable name section and click on the save icon.
- Click on the code tab, write the file name for your code and choose the file extension as "js".
- Write your code for data visualisation -
setChartType('lineGraph');
setAxisName('time_stamp','temp');
plotChart('time_stamp','temp');
7. Since I have added temp variable name for pin A0. So I need to pass the same variable name in the graph code. You can read more about graph code here.
8. Now go to the dashboard and click on the view this device icon
Step 3: Creating alert
Before creating the alert open Bolt IoT android app and login into the app. Follow steps for creating the alerts.
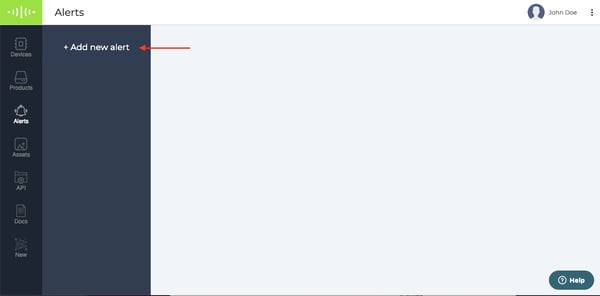
1. Visit Home page of Bolt cloud
2. Click on the alert icon and click on the add new alert
![]()
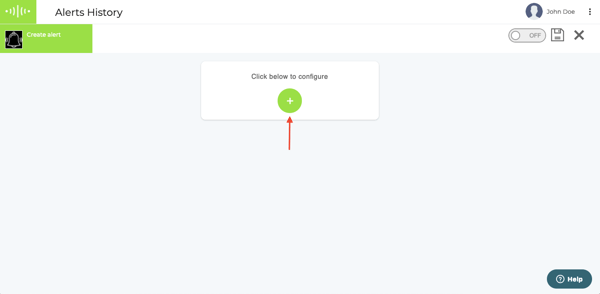
3. Click on the add icon to see the option for creating the alerts.
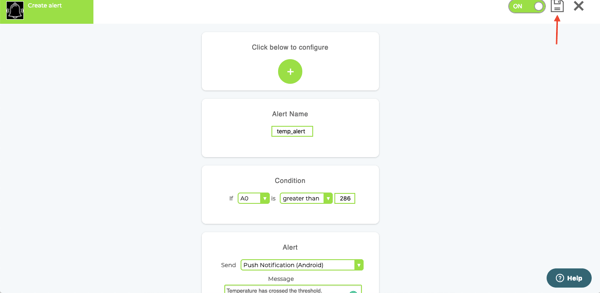
4. Assign a name to the alert feature, choose the pin from where you are collecting the data, assign the condition.
5. Enter the message and enable the alert from the toggle button and click on save.
6. After creating an alert, you will be redirected to alert dashboard.
7. Now select the alert and click on the link icon and choose the device to link with alert.
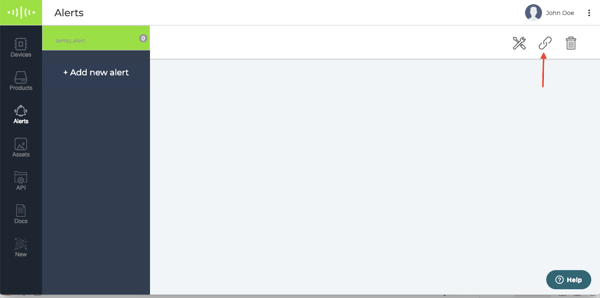
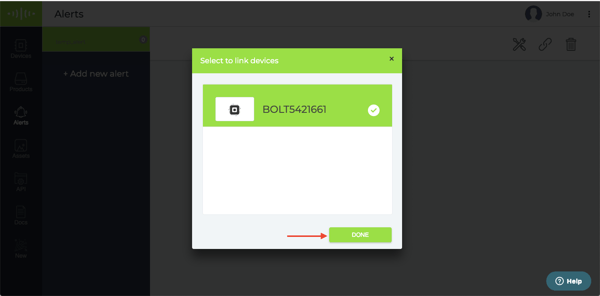
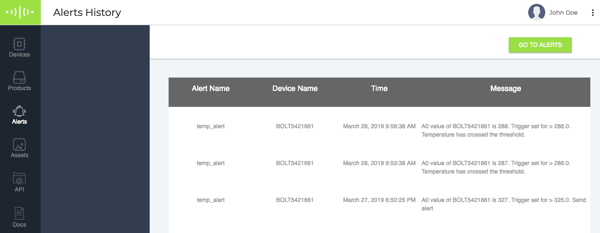
8. As soon, the device sends a data greater than 286, I received a push notification on my android phone and you can check in the alert log. To see the alert log, click on the profile icon and then click on the Alerts History and you can see all the push notification sent.
For details about refer the alert documentation.
Want to build more such IoT and ML projects? Want to learn IoT and ML from basics?
Check out the Bolt IoT and ML training. This online video training is excellent for those who want to start with IoT and ML because it teaches you to build projects from the basics. Click on the button below to know more about the training.


